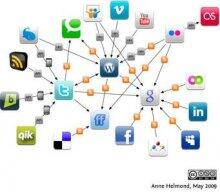
Understanding the factors of network formation is a fundamental aspect in the study of social dynamics. Online activity provides us with abundance of data that allows us to reconstruct and study social networks. Statistical inference methods are often used to study network formation. Ideally, statistical inference allows the researcher to study the significance of specific factors to the network formation. One popular framework is known as Exponential Random Graph Models (ERGM) which provides principled and statistically sound interpretation of an observed network structure. Networks, however, are not always given set in stone. Often times, the network is "reconstructed" by applying some thresholds on the observed data/signals. We show that subtle changes in the thresholding have significant effects on the ERGM results, casting doubts on the interpretability of the model. In this work we present a case study in which different thresholding techniques yield radically different results that lead to contrastive interpretations. Consequently, we revisit the applicability of ERGM to threshold networks.
Publications
2017
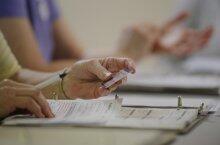
Over the past 12 years, nearly 20 U.S. States have adopted voter photo identification laws, which require voters to show a picture ID to vote. These laws have been challenged in numerous lawsuits, resulting in a variety of court decisions and, in several instances, revised legislation. Supporters argue that photo ID rules are necessary to safeguard the sanctity and legitimacy of the voting process by preventing people from impersonating other voters. They say that essentiall every U.S. citizen possesses an acceptable photo ID, or can relatively easily get one. Opponents argue that that’s not true; that laws requiring voters to show photo ID disenfranchise registered voters who don’t have the accepted forms of photo ID and can’t easily get one. Further, they say, these lallws confuse some registered voters, who therefore don’t bother to vote at all. Opponents also point out that there are almost no documented cases of voter impersonation fraud. Supporters counter that without a photo ID requirement, we have no idea how much fraud there might be.
2016
Barack Obama can spin a good phrase, and while his political opponents like to say his actions don’t always match his soaring rhetoric, there’s no denying the man has said a lot: So far in his presidency, he’s given more than 2,000 official speeches, uttering about 3.5 million different words. So what has he actually been telling us? To answer this question in a whole new way, we analysed all of Obama’s speeches through the end of September and looked at how frequently different terms came up. Surprises abound: Afghanistan was the most-mentioned country after the United States. He talks football more than basketball, Pelosi more than Reid and "change" more than "hope" - except in 2012. Here’s a unique look at what’s really on Obama’s mind.
Experimental research in traditional laboratories comes at a significant logistic and financial cost while drawing data from demographically narrow populations. The growth of online methods of research has resulted in effective means for social psychologists to collect large-scale survey-based data in a cost-effective and timely manner. However, the same advancement has not occurred for social psychologists who rely on experimentation as their primary method of data collection. The aim of this article is to provide an overview of one online laboratory for conducting experiments, Volunteer Science, and report the results of six studies that test canonical behaviors commonly captured in social psychological experiments. Our results show that the online laboratory is capable of performing a variety of studies with large numbers of diverse volunteers. We advocate for the use of the online laboratory as a valid and cost-effective way to perform social psychological experiments with large numbers of diverse subjects.
There have been serious efforts over the past 40 years to use newspaper articles to create global-scale databases of events occurring in every corner of the world, to help understand and shape responses to global problems. Although most have been limited by the technology of the time (1) [see supplementary materials (SM)], two recent groundbreaking projects to provide global, real-time "event data" that take advantage of automated coding from news media have gained widespread recognition: International Crisis Early Warning System (ICEWS), maintained by Lockheed Martin, and Global Data on Events Language and Tone (GDELT), developed and maintained by Kalev Leetaru at Georgetown University (2, 3). The scale of these programs is unprecedented, and their promise has been reflected in the attention they have received from scholars, media, and governments. However, they suffer from major issues with respect to reliability and validity. Opportunities exist to use new methods and to develop an infrastructure that will yield robust and reliable "big data" to study global events - from conflict to ecological change (3).

"Man is by nature a political animal," as asserted by Aristotle. This political nature manifests itself in the data we produce and the traces we leave online. In this tutorial, we address a number of fundamental issues regarding mining of political data: What types of data would be considered political? What can we learn from such data? Can we use the data for prediction of political changes, etc? How can these prediction tasks be done efficiently? Can we use online socio-political data in order to get a better understanding of our political systems and of recent political changes? What are the pitfalls and inherent shortcomings of using online data for political analysis? In recent years, with the abundance of data, these questions, among others, have gained importance, especially in light of the global political turmoil and the upcoming 2016 US presidential election. We introduce relevant political science theory, describe the challenges within the framework of computational social science and present state of the art approaches bridging social network analysis, graph mining, and natural language processing.
2015
While numerous political commentators have offered up their opinion about who won or lost last week’s GOP debate, we here at the Lazer Lab at Northeastern University spent the last week looking at the numbers. Actually, we looked at the words: What did candidates actually talk about? How much did they talk, and for how long? The answers gave us three new ways to think about what mattered in the debate, and who won.

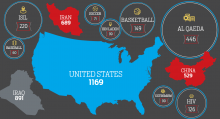
Democrats talk about Iraq; Republicans talk about.........Panama? This week is a big one for America’s global relations. While Congress started hashing out whether to hand the president authority to finish the largest trade deal in history, Obama was wrapping up the G-7 economic summit in Germany. Beneath the talking points, what are America’s real priorities when it comes to the rest of the world? We decided to analyze what Congress actually talks about with it discusses foreign affairs - essentially, to draw a map of the world as seen from Capitol Hill. We took all the public statements of members of Congess from 2009 to 2014 (thanks go to VoteSmart for compiling them) and crunched them to see what countries Democrats and Republicans talk about, how their lists differ, and they view those countries as connected.

Every day, millions of people use Google to dig up information that drives their daily lives, from how long their commute will be to how to treat their child’s illness. This search data reveals a kit about the searchers: their wants, their needs, their concerns - extraordinarily valuable information. If these searches accurately reflect what is happening in people’s lives, analysts could use this information to track diseases, predict sales of new products, or even anticipate the results of elections.